As promised in my last post about WiFi and certificate-based authentication, I spent some time creating a new SyncML Viewer version v1.3.0. This time I would say I focused on the usability of the tool. I added a lot of features since version 1.2.0. I’m going to demonstrate a few of them and release the new version to the public with this post. I hope they are as useful as they are for me during my tests and troubleshooting.
If you want to have some info about the tool have a look at these posts as well:
- Windows 10 MDM client activity monitoring with SyncML Viewer
- New SyncML Viewer version
- MDM Local Management using SyncML Viewer
Let’s jump right into it. As you can see in the following screenshot I also worked on the small things. I’ve added a capturing traffic indicator in the lower right. Capturing in general can be toggled with F12. I added the filename in the title if a SyncML stream is loaded. And the message will now get parsed nicely even if the message is truncated and malformed. Finally in this screenshot you can see a small * on the message entry no. 4:

The little * indicates a comment I’ve added. You can now add comments to the sessions or messages:

For better analysis I’ve added a few more actions to support various tasks:
- Action > Lookup Status Code (MDM and Win32 Error status code lookup) (Ctrl+E)
- Action > Decode Certificate (Ctrl+N)
- Action > Search with Google (F1)
- Action > Open in Notepad (Ctrl+Shift+O)
Looking up a status code (Ctrl+E):

or here a failed one:

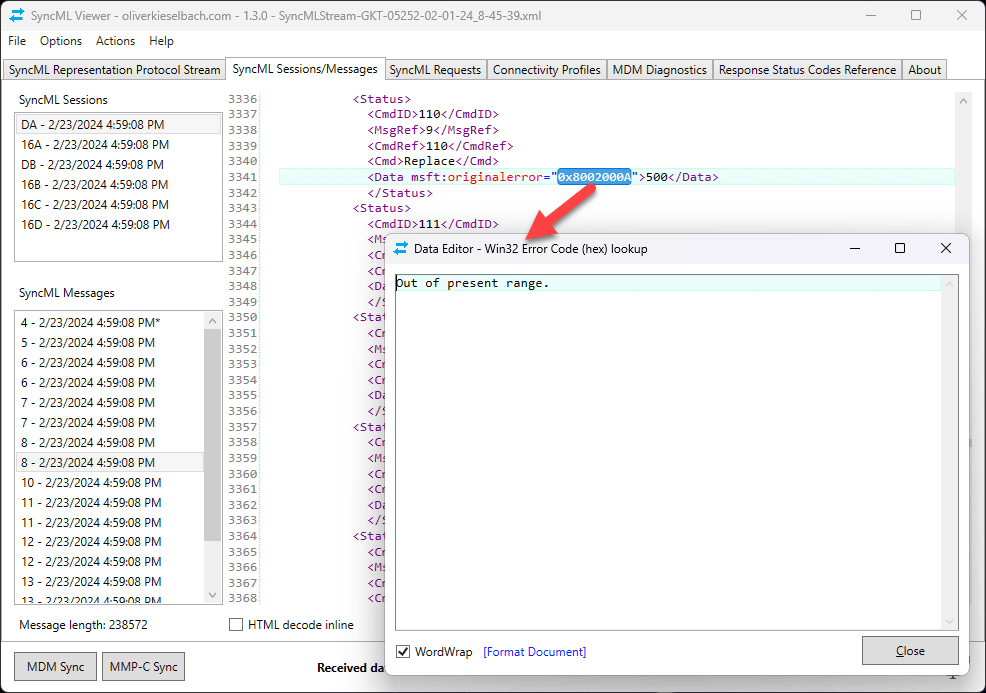
Also, the Win32 Error codes I try to resolve:
To decode a Certificate, I used nested decoding in the following example, first decode from Base64 (Ctrl+B) then again decode Base64 (Ctrl+B) and finally decode the certificate (Ctrl+N):

Here we have easy search the selected text in Google with key F1:

As I was dealing with WiFi troubleshooting, I was able to trace the received WiFi profiles (also VPN profiles), but for troubleshooting it is nice to list also the stored profile and an option to delete them or get further information. So, I’ve added Connectivity Profiles for WiFi und VPN. For WiFi we can view some extra info by using the links below:


There are also some quick access Actions to generate the MDM report (the same as the one from Settings in Windows) and an Action to open the MDM Eventlog:

Advanced Diagnostic Report:

MDM Eventlog:

In the section SyncML Requests you now have more control of the behavior. You can keep the local MDM enrollment until you close the SyncML Viewer tool. This is nice to experiment more and keep the setting during your whole troubleshooting until you close everything:

Sure, there can go things wrong sometimes. Therefore, I’ve added an Action to Cleanup local MDM Enrollments. Enrollments which never got unregistered and are more or less orphaned enrollments:

And for a special use case I’ve added a hidden Experimental feature to redirect local MDM SyncML requests to the real MDM enrollment. WARNING, this should be used with care, you may break your device easily and it will not sync anymore. So, use it on test devices and it is advised that you really know what you’re doing. The idea is simple you can set something and the final result will be in the real MDM enrollment. This leads to several consequences! It will not be removed finally and also the real MDM got an additional entry which was never sent by the real MDM Server. So, you’re tempering with your MDM enrollment!
First, I’ve set the setting to keep the local MDM enrollment until exit of the tool:

I used the Replace command with HideTaskViewButton to show this behaviour:
REPLACE ./Device/Vendor/MSFT/Policy/Config/Start/HideTaskViewButton INT 1

This is the successful result. We checked “keep the enrollment until exit” earlier and we can see the new Local MDM enrollment ID under MDM Diagnostics:

With this info we can use Ctrl+Alt+P to open the registry for the PolicyManager key and we can find the Local MDM enrollment unter PolicyManager/providers/LocalMDMEnrollmentID and the setting we’ve set:

Now let’s redirect the command to the real MDM enrollment (again with care!!, this can break something). This time I’m clicking the “Run Request” button and hold down “Ctrl+Shift“. You will see the following Warning (see below) and if you click OK it will execute the command against the real MDM enrollment:

After confirming with OK we open again the registry, but now we have a look into the real MDM enrollment PolicyManager/providers/RealMDMEnrollmentID, the ID is found also in the MDM Diagnostics tab:

I’m aware of use cases where this can be helpful, but again if you are not my dear fellow Rudy 😂 and you’re not knowing what you’re doing you could harm your device!
Download and feedback
I hope these usability enhancements will help research and dig into the MDM stack. If there is feedback leave a comment or open an issue on GitHub.
The project is maintained on GitHub here:
https://github.com/okieselbach/SyncMLViewer
Here a direct link to the zip archived program:
https://github.com/okieselbach/SyncMLViewer/tree/master/SyncMLViewer/dist

Is it fair to say this tool is like gpresult but for Intune ?
No not in total as it’s is not preparing a html report but you can achieve similar outcome. Check for setting which getting applied. I would compare it a bit to fiddler. An http traffic analyzer.
looks great, thanks for dedicating your time towards something so helpful for the community 👌