

Do you ever wanted to know what is going on behind the curtain when clicking MDM Sync on Windows 10? Gaining insights into how the SyncML representation protocol is used during device management of Windows 10 clients? With SyncML Viewer you have the chance to easily get deep insights now. I’ve written a small tool to view the SyncML representation protocol on Windows 10 in real time. In fact, this isn’t a special hack, Microsoft provides so-called ETW providers which are able to give you all relevant information. There is a great blog post from Michael Niehaus (Want to watch the MDM client activity in real time?), which inspired me to write this small troubleshooting helper tool.
The Message Analyzer approach Michael described felt a bit complicated to setup (choosing provider and setup columns to filter for the relevant events). Despite the initial setup the approach is great and delivers deep insights, but personally I wanted to have something simpler for troubleshooting. I wanted to be able to start a small tool and get all protocol information I want in a proper view. Therefore, I decided to build my own tool named SyncML Viewer. After quite a bit of research regarding the correct ETW providers to use (special thanks to Matt Graeber for providing detailed ETW provider details here) and suitable layout elements for presentation, I finally have version 1.0 as community release.
The project is maintained on GitHub here:
https://github.com/okieselbach/SyncMLViewer
Here a direct link to the zip archived program:
https://github.com/okieselbach/SyncMLViewer/tree/master/SyncMLViewer/dist
SyncML Viewer will show in real time all SyncML xml-based representation protocol information, exchanged between the Windows 10 client and the management system (Intune), in one long stream:

You can easily look through the complete sync session and even search for elements:

The protocol is designed to have session information for one sync action and exchanged messages belonging to that SyncML session. To step through this a bit easier I parse them and provide a specialized view for it on the second tab, which lists individual sessions and exchanged messages belonging to that session:

For protocol analysis it is quite handy to have the status code reference from the official OMA SyncML Representation Protocol documentation available. I’ve added the response status codes and made them easily searchable:

This should give you an easy way to analyse what’s actually going on.
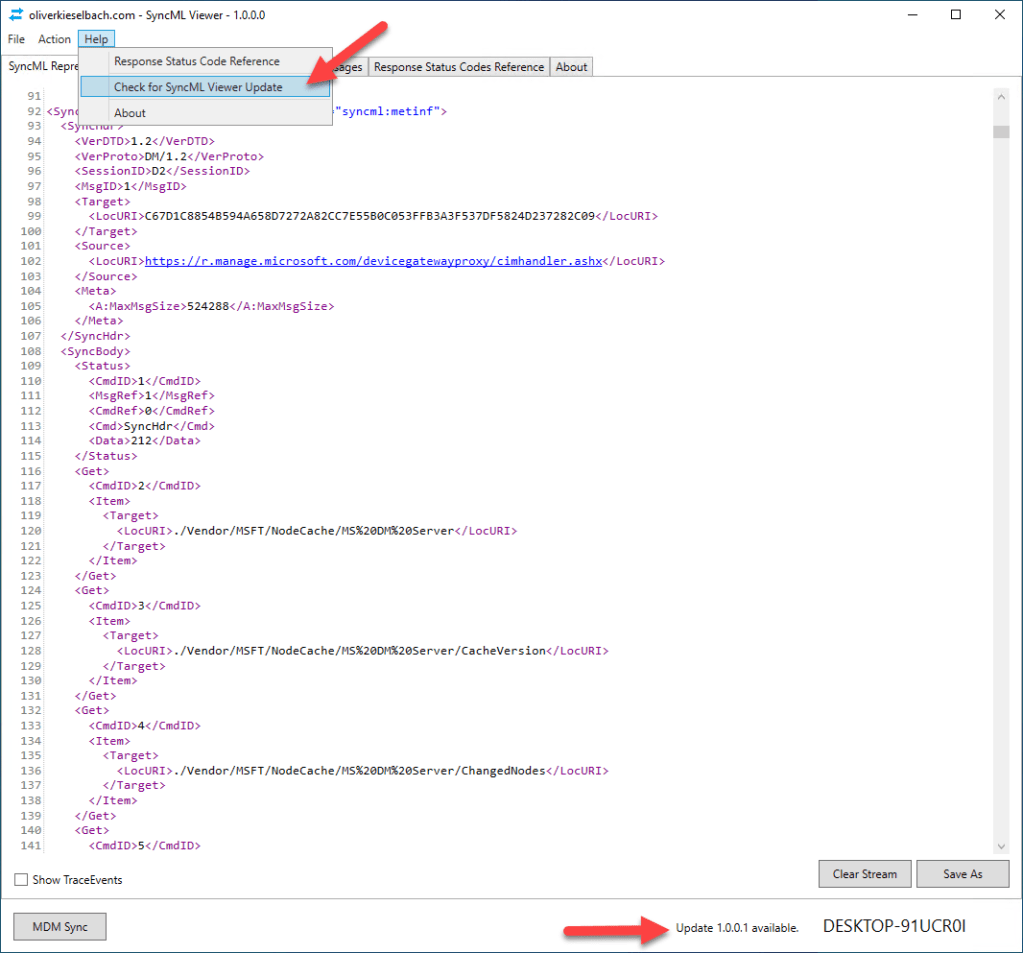
To provide the ability to deliver ongoing updates to the tool, I added a small update functionality which will indicate if there is a new version available and on manual check (Menu Item > Help > Check for SyncML Viewer Update) it will trigger a download and install of the new version:
Viewing the OMA DM protocol and the xml-based SyncML representation helps me to deepen my understanding and check if an actual setting configured in Intune is transferred to the Windows 10 client and actually set.
For example, I’ve setup my tenant to automatically convert devices to Autopilot devices with the following setting on the Autopilot profile:

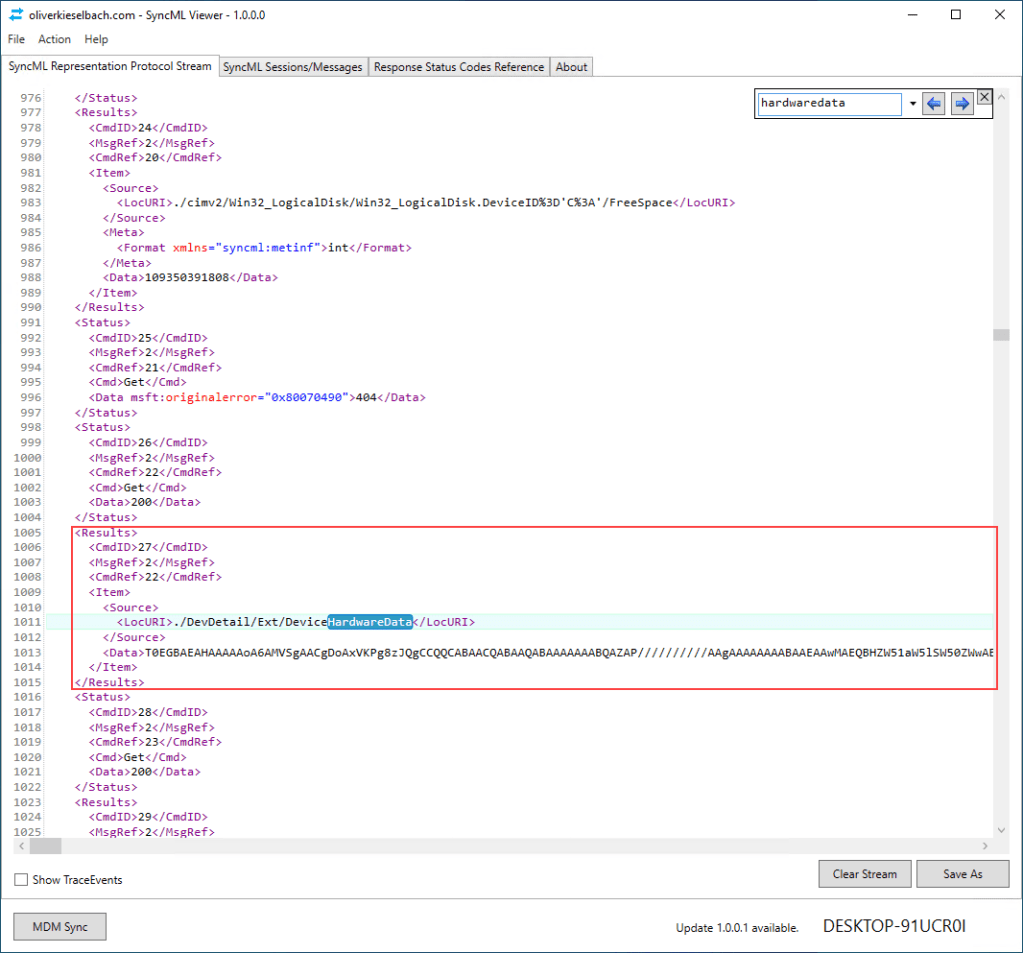
Therefore, I would assume that Intune queries the device to gather the hardware hash of the device. If we analyze the SyncML stream we find evidence that Intune is actually doing that:
As seen, it is really useful and helps to get a better understanding of the MDM Sync and underlying protocols.
The latest version also has a background logging mode, found in the new Options menu item. If enabled all output is routed to a log file within the same directory as the SyncMLViewer.exe.
Did you know? If you want to monitor the logfile in real time on the console, there is an equivalent to “tail -f” unix/linux command also on Windows via PowerShell with the Get-Content cmdlet and the -Wait parameter. If you have never heard of the tail -f command, it allows you to parse a log file with a live update on the console. Demonstrated below now via PowerShell and the background log file:
Get-Content .\SyncMLStream-XXX.xml -Wait

Feel free to propose features or enhancements on the GitHub solution.
Happy tracing everyone!
UPDATE: a couple of follow up posts are released in the meanwhile

I had started on something like that a couple of times, but always realized that I didn’t have time to finish it 🙂
I spent a few night shifts for it :-), was actually fun to code. I really like to refresh my coding skills from time to time. Happy to take feedback or pull requests to enhance it further 👍
Really useful. Thanks for doing this.
I have a case where the Windows Projection settings don’t work in the Intune device restrictions policy, but they do work in custom OMA-URI settings. This tool would show the difference.
Great article! I was able to get more insights on AV compliance check for Win 10 devices based on this article. Thank you.
the ability to store the data to disk constantly instead of the save as button would be great. We are facing an issue wich occurs random and would like to run this tool to collect diagnostics data constantly.
Hey Jonas,
good idea I will add it to my backlog and code it when I have time. Good suggestion.
best,
Oliver
Really nice and hopefully help us troubleshoot Intune issues more effectively 👍.
I was also struggling with a lack of reporting data about what Intune client does. So maybe this will help others too https://doitpsway.com/get-a-better-intune-policy-report-part-3
Hi,
I can’t seem to find the search function?
Use CTRL + F to get the search box 👌
Got it! 🙂
Thanks for the prompt response.
Any chance this can work when the sync that is initiated via another request? Like, “start viewing all current messages”.
Trying to use this during AP pre-provisioning to track why a FW policy isn’t getting implemented correctly. The sync in this case is kicked off by that process.
Nevermind. It was capturing. I was using a backing file and didn’t look at it before I posted. I forgot it wouldn’t show the messages on the screen while using the backing file.
Does setting catalog use SyncML? Many of my policies are not shown in the viewer.
everything is transferred via SyncML protocol, you may not see the settings as the buffer I have is only 64KB per trace message, so in case the client exchanges big policies the message gets truncated (buffer limitation of ETW with 64KB in size). Sadly I can’t extend the buffer, this is fixed by MS. so in cases with large policies the data is truncated. for troubleshooting you could un-assign a bunch of policies and leave the suspected one assigned, so this will reduce message size and therefore it will be traced again.
Sorry, for dumb question, but how can I run that tool? I downloaded zip file from github, but I can’t run it. Do I need visual studio for that? Thank you.
The easiest way ist probably installing it via Winget and then just typing syncmlviewer
Otherwise you need to download the correct package from GitHub. See under folder dist. There are archives with the tool. Or look in the releases section. There is also an archive with the binary included.