In a lot of Microsoft Intune environments there is often the requirement to monitor configuration changes and taking action based on changes. The most simple and common action is to send someone or a group of people an email that a policy was modified. These monitoring requirements are often given for special purpose devices like Privileged Access Workstations (PAW). A change of PAW device policies must be notified to a group of people to make sure it is an intended change as these policies control the hardening aspect of these important devices and you don’t want something to be modified unintentionally or by accident. I’m going to show how to use Log Analytics and Azure Monitor to monitor policy changes for a certain set of policies.
When a policy configuration set in Intune is finalized and applied to your environment it is advised to follow a common naming scheme. This makes it easier to maintain policies and easier to work with them in an automation perspective. A naming scheme which has been proven to be easy to understand and practical during day-by-day operations and automation tasks for example is this:

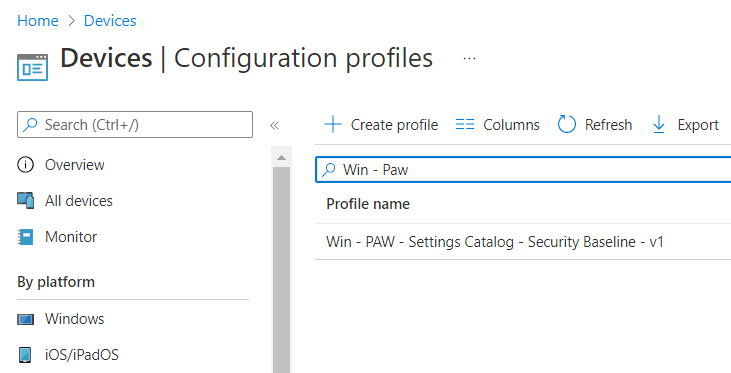
Now once you have your policies organized you might end up in different sets like the “default” set for all you standard clients and a “kiosk” set for all kiosks etc. Also, a lot of companies are implementing Privileged Access Workstations (PAW) lately and therefore have a policy configuration set starting with “Win – PAW” if they follow the naming scheme from above. This prefix can be used perfectly for some monitoring tasks. Here an example policy following the naming scheme:
First, we need to configure Intune Diagnostic settings to ship AuditLogs to a Log Analytics workspace. This can be done in the Reporting section of Intune, under Diagnostic settings by clicking on “Add diagnostics settings” and then choosing AuditLogs to be shipped to a newly created Log Analytics workspace or an existing one. Once the Audit information is shipped to a Log Analytics workspace, we can use Log Analytics native Alert rules to create our Monitoring solution.

To create a new Alert rule we need to open Log analytics under Reports and paste the following Kusto Query Language (KQL) query into the query editor:
IntuneAuditLogs
| where OperationName == "Patch DeviceConfiguration"
    or OperationName == "Patch DeviceManagementConfigurationPolicy"
    or OperationName == "Patch DeviceManagementIntent"
    or OperationName == "Update GroupPolicyConfiguration"
    or OperationName == "Create DeviceConfiguration"
    or OperationName == "Create DeviceManagementConfigurationPolicy"
    or OperationName == "Create DeviceManagementIntent"
    or OperationName == "Create GroupPolicyConfiguration"
    or OperationName == "Delete DeviceConfiguration"
    or OperationName == "Delete DeviceManagementConfigurationPolicy"
    or OperationName == "Delete DeviceManagementIntent"
    or OperationName == "Delete GroupPolicyConfiguration"
| extend PropertiesJson = parse_json(Properties)
| where PropertiesJson.TargetDisplayNames[0] startswith "Win - PAW"
| extend ActorJson = parse_json(PropertiesJson.Actor)
| project TimeGenerated=TimeGenerated, ConfigurationProfile=PropertiesJson.TargetDisplayNames[0], UPN=ActorJson.UPN, Operation=OperationName
The query searches for Audit log entries which are related to creation, modification, and deletion of policy configuration objects. These objects must start with “Win – PAW” (our naming scheme) and then parses some relevant information like time of modification, policy name, actor UPN and which operation was done. This can be seen in my screenshot below as I already had some results. If you want to monitor different policy sets just change the startwith “Win – PAW” to something different like “macOS – Default”. After pasting hit the Run button, otherwise the “+ New alert rule” will not be enabled and then click on “+ New Alert rule”.

After you clicked in “+ New Alert rule” you will see some options to configure. We need just some values for the Alert logic. The operator must be greater than or equal to and the Threshold must be set to 1, as we want a notification as soon as 1 policy is changed.

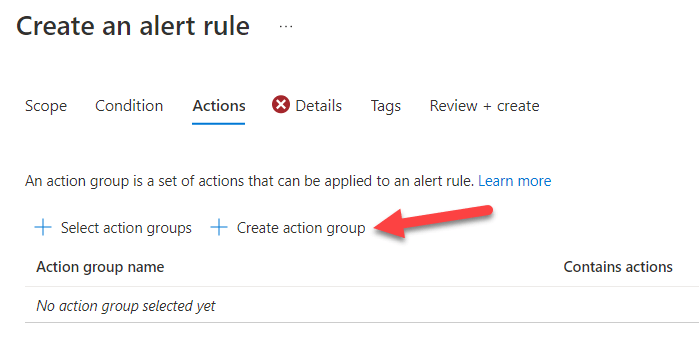
Next, we are going to create an Action group which is responsible to send the email for our query results:
Here we fill in the details, creating an Azure Resource Group and providing a name:

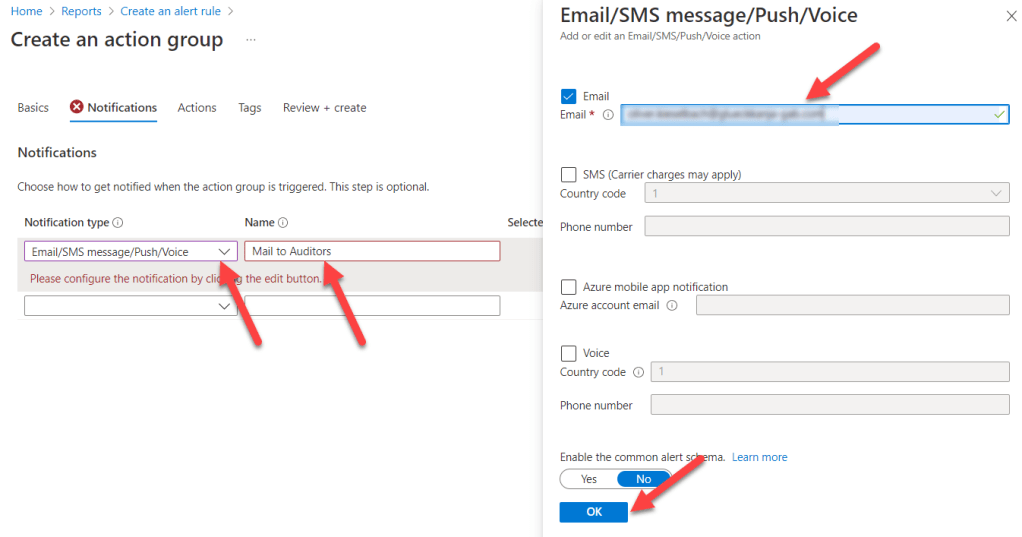
Next, we choose the email notification type and provide an email address to send to:
We skip the next wizard page Actions as we do not call a Runbook, Function, etc. In this example we are simply sending an email. You could extend this here to call maybe a runbook to trigger additional actions.

Next section Tags will be skipped here (you might need it if you are tagging azure resources for billing etc. purposes) and finally we click Review + Create
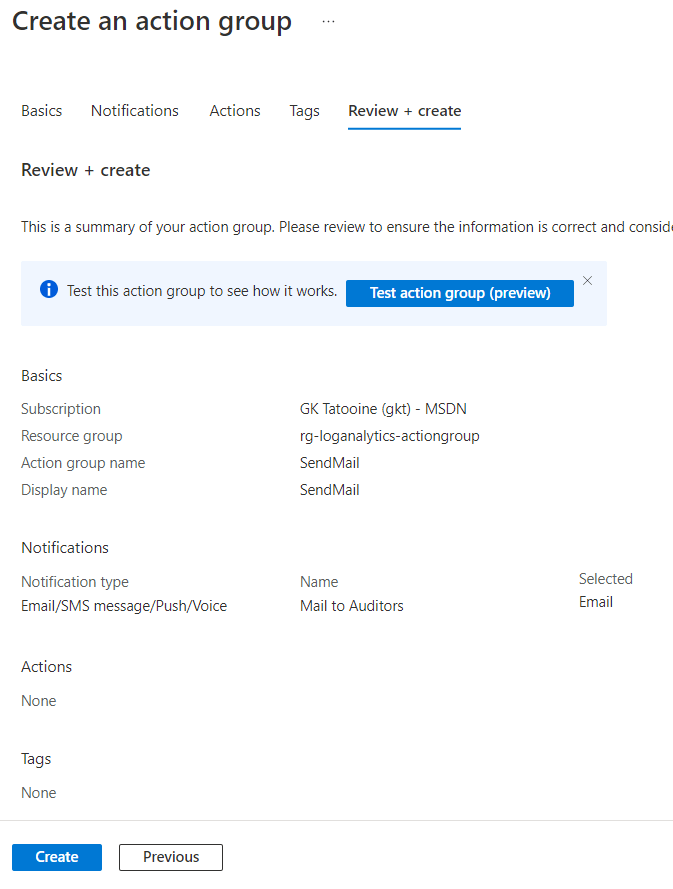
We get back to the original Alert creation wizard and we will see the freshly created SendMail entry. Following the Wizard by clicking Next: Details >

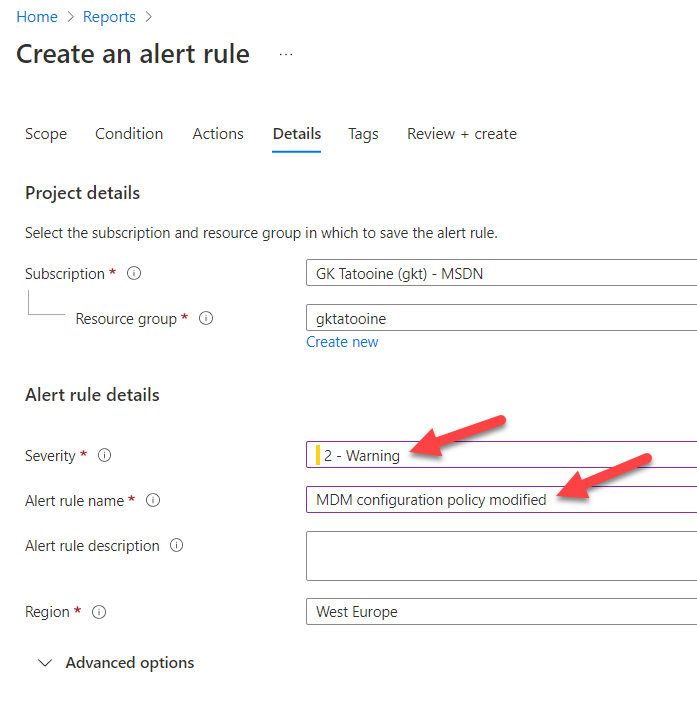
Now we are providing the severity level and an alert rule name. I will get the attention of the receivers, so I mark the alert rule as a Warning and give it a meaningful name. The name will later be seen in the email so we should choose something descriptive.
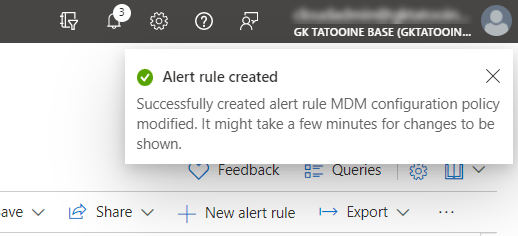
After clicking Review + Create we should see a short notification in the portal of the successful creation of the alert rule:
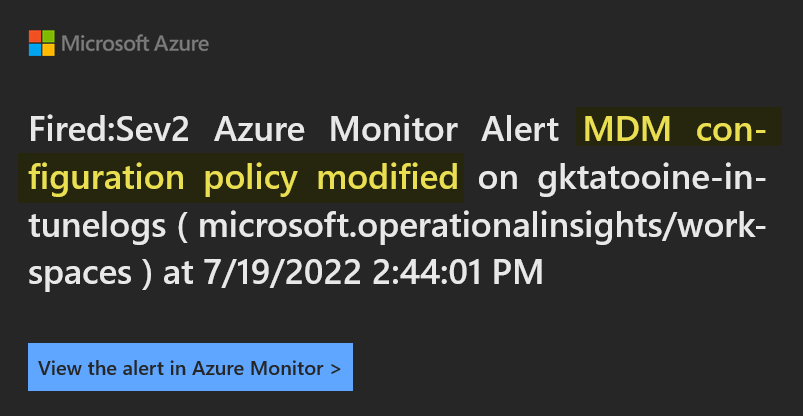
To check if the Alert rule is working, we need to create, modify, or delete a policy starting with the name “Win – PAW”. If this is done an email should be send to the receiver group/person within 5 min. In the email you have various links to open the Azure portal to get more details. The email looks like this:

If you follow the link filtered search result you will get the KQL query result with the exact names, operation, timestamp etc., like designed in the beginning:

To check or review the configured alert rule we can navigate in Azure portal to our Log Analytics workspace, or we follow the link in the Intune portal under Tenant administration:

It will bring us also to the Log Analytics workspace blade from azure. Here we can scroll down to the Alerts to view the fired alerts and also the configured alerts rules again:
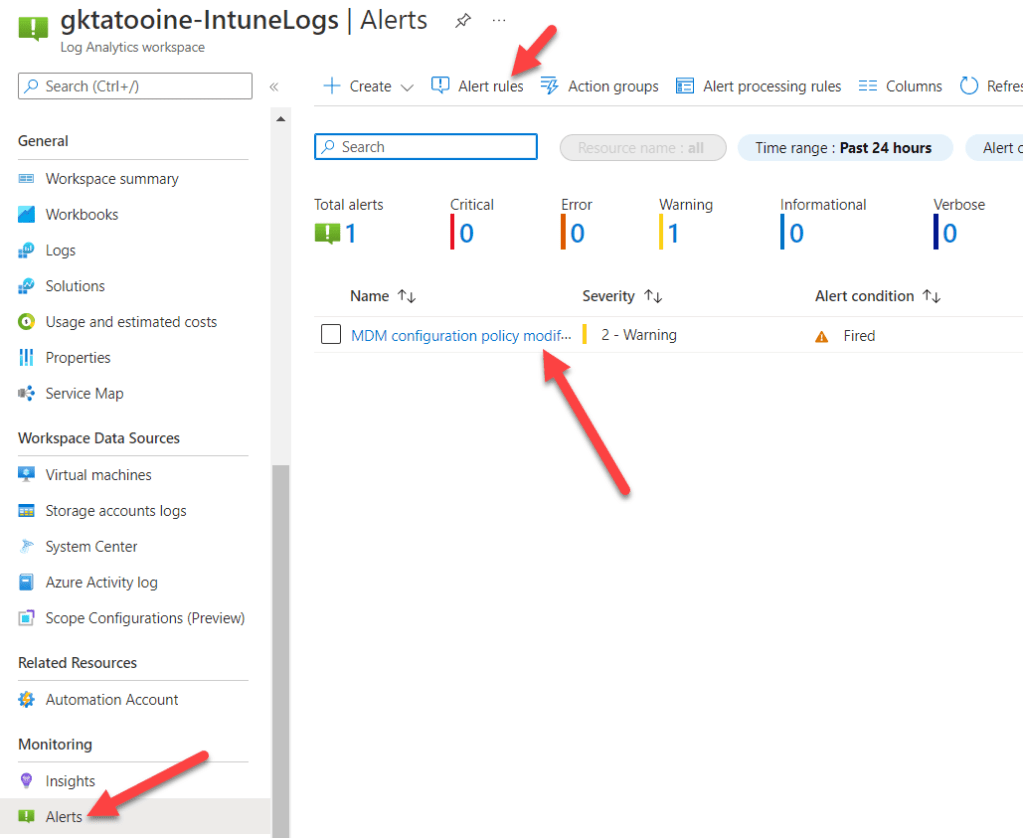
After click on “Alert rules” you can modify the properties of the configured rule again:

This should give everyone a good starting point how to use Log Analytics workspaces and alert rules to send notifications or trigger also additional actions like runbooks after a KQL search query provides a result of your interest.
The solution above is simple and has minimal amount of cost associated with it (1,50$) and gives an additional layer of awareness, if important objects (configuration profiles) are modified. The example could be easily adapted to other events which might be from interest in your environment.
The most difficult part is the KQL query to get the desired results. But in the Microsoft ecosystem a lot of information is stored in Log Analytics workspaces, so it is wise to look at KQL and learn the syntax a little bit as it can be used in many other areas as well.
Happy monitoring!

Thanks for this great article. Is there anyway to include the details of the changes in the alerts? I am struggling with reading the audit logs in Intune to adjust the project details.
Example. Setting1 went from on to off, Setting 2 was added to policy. It seems their audit logging doesn’t do detail. Just many new value old value with blanks, but nothing on the settings themselves. Thank you for any help you can provide. Nick
Same here didn’t figure out how to get the changed values but also didn’t spend too much time on it as it was not needed for what I used it for.
Is there a way to publish the alert to a Teams channel?
I think there is, but I never tested it and implemented it at the moment… go to the official docs from MS there should be some advice how to do it.
Joe… When creating the alert rule you can specify an email address. That email address can be your channel email address. You can right click on the channel to get the address, but you also have to allow the email to reach your channel by putting it in the in allow list for the channel or for the tenant.
https://support.microsoft.com/en-us/office/send-an-email-to-a-channel-in-teams-d91db004-d9d7-4a47-82e6-fb1b16dfd51e
https://practical365.com/how-to-control-sending-email-to-teams-channels/
Verify that emails from these three addresses are not blocked:
azure-noreply@microsoft.com
azureemail-noreply@microsoft.com
alerts-noreply@mail.windowsazure.com
Is there a way to add a column for what settings are being changed? Thank you.
It wasn’t in my scope at the time of development. So, there might be some property which gives you that information. You have to look at the log analytics entry more closely if you can find them there. If so, you can query them in addition, but again I wasn’t looking for that at the time of development.