
In a modern managed environment we deal with highly mobile Windows 10 users. The MDM capabilities in Windows 10 allows enterprises to manage these devices even when distributed all over the globe. This is a great enhancement as we can configure and check compliance of devices every time. But most advantages also introduce some disadvantages and these are the ability to effectively troubleshoot devices like we did in the past. Just walk by and have a look at the event log entries or grab some log files isn’t possible most of the time. Even remote sessions can be challenging, especially when dealing with different time zones. Luckily Microsoft introduced a new capability to cover this scenario with an updated DiagnosticLog CSP (as per 2019-04-23 docs are not updated to include the latest Version 1.4, 2019-09 docs are updated to version 1.4, DiagnosticLog CSP for triggering devices to upload files to cloud). The new diagnostic capabilities are best described in one sentence:
It is possible to gather on-demand diagnostic log files from Windows 10 via the MDM channel.
Prerequisites
Windows Insider or Windows 10 Version 1903 which includes the DiagnosticLog CSP in Version 1.4.
Procedure
The procedure is very simple and can be broken down into a server part and device part which follows some easy steps. For the server part there are 3 steps:
- The IT Pro specifies the data collection definition in form of a XML structure. The types supported here are: event logs, log files, command output, and registry
- The IT Pro provides a provisioned cloud storage and a shared access signature (SAS) URI for the upload
- The MDM server (in this case Intune) sends the data collection and upload URI to the device
The device part can also be broken down into 3 steps:
- The Device evaluates the data collection XML via DiagnosticLog CSP and drops entries which violates privacy guardrails. Guardrails define allowed paths, commands, extensions, etc. – C:\Users\… is not allowed for example.
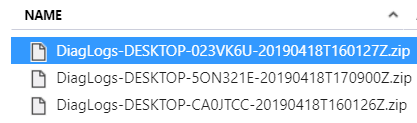
- The Device gathers remaining data collection directives and puts them into a single zip archive labled with hostname and time stamp
- The device uploads the .zip file to the provided cloud storage SAS URI
Finally we can access the storage account and have our data collection package available for download and troubleshooting:
How can we configure data collection via MDM now?
We start by creating an SAS upload URI for the diagnostic log zip archive. I’ll assume an Azure Blob Storage is already created otherwise look here Create a storage account. If the storage account is in place we can simply generate a new container like diagnosticlogs and then generate a SAS upload URI for it. We restrict it to the necessary permissions which are needed, in this case creation of blobs for a limited time and then copy the Blob service SAS URI (learn more about SAS here ‘Using shared access signatures (SAS)‘):

As soon as we have done this we need to put in our newly created container name diagnosticlogs into the ‘Blob service SAS URI’ (copied from the portal – Shared access signature blade) as shown below. The updated URI is needed to make sure our archives are uploaded to our container diagnosticlogs:
https://xxx.blob.core.windows.net/diagnosticlogs?sv=2018-03-28&ss=b&srt=o&sp=c&se=2020-04-23T16:06:10Z&st=2019-04-22T08:06:10Z&spr=https&sig=xxx
On the placeholder xxx you will see your storage account name and your signature of the account. This URI is needed next in the data collection definition xml.
Next we are defining the ‘data collection’ xml structure. This xml represents the actual diagnostics data collection request for the client. In the following example are all available options included event logs, log files, command output, and registry. Feel free to copy and modify it for your needs (inlcude your SasUrl). Important to notice here is the ID, as this is a manually generated GUID which is needed for the DiagnosticLog CSP to keep track of execution. Once the diagnostic data is collected the ID is remembered in the registry (HKLM\SOFTWARE\Microsoft\MdmDiagnostics\{id}). This ensures that the diagnostics data collection runs only once. If you whish to run it again the GUID needs to be changed. This can easily be accomplished by generating a new Guid via PowerShell and the New-Guid command and updating the xml. Following an example data collection xml definition (use your own SAS URI with the replaced xxx placeholders!):
<Collection>
    <ID>480dd977-3ff0-41d5-a7e9-bdfb837f9769</ID>
    <SasUrl><![CDATA[https://xxx.blob.core.windows.net/diagnosticlogs?sv=2018-03-28&ss=b&srt=o&sp=wac&se=2020-04-18T23:53:39Z&st=2019-04-17T15:53:39Z&spr=https&sig=xxx]]></SasUrl>
    <RegistryKey>HKLM\Software\Policies</RegistryKey>
    <RegistryKey>HKLM\SOFTWARE\Microsoft\Clipboard</RegistryKey>
    <Command>C:\windows\system32\ipconfig.exe /all</Command>
    <Events>Application</Events>
    <Events>System</Events>
    <FoldersFiles>C:\Windows\*.log</FoldersFiles>
    <FoldersFiles>C:\ProgramData\Microsoft\Network</FoldersFiles>
</Collection>
To demonstrate how flexible this approach is, you might want to use constructs like generating a MDM diagnostics report locally to a temp folder and gather the output after generation:
<Command>%windir%\system32\mdmdiagnosticstool.exe -out %ProgramData%\temp\</Command>
<FoldersFiles>%ProgramData%\temp\*.*</FoldersFiles>
As a last step we need to define the custom configuration profile in Intune to push this instructions to the device were we want the diagnostics data to be collected from. Following the custom OMA-URI definition:
OMA-URI: ./Vendor/MSFT/DiagnosticLog/DiagnosticArchive/ArchiveDefinition
Data type: String
Value: <data-collection-xml>
This is how it looks like when configured in Intune:

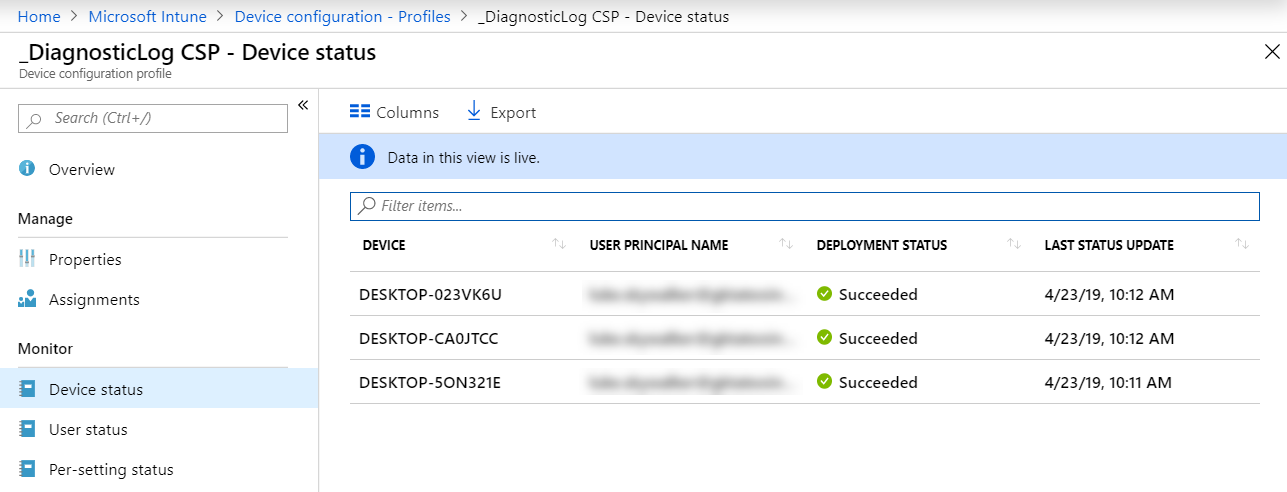
Now you need to wait for the next device check in to deploy the new custom profile to the targeted device:
If everything was successful you will see your diagnostic data archive packages in the Azure blob storage container diagnosticlogs:

Just select one and on the sub menu click on download to get the zip archive. After extraction you will see a folder structure and a results.xml file:

The data collection xml sequence defines the folder structure. In this example folder 1 maps to Registry HKLM\Software\Policies, folder 2 to the next registry directive and folder 3 to the command directive and so on. The extracted archive folders 1,2,3… may have, according your data collection definition, the following files for troubleshooting then:
RegistryKey – export.reg – a simple registry export of the path specified
Command – output.log – the captured command output
Events – Events.evtx – exported event log entries
FoldersFiles – your captured files from the path specified
The results.xml file tracks the results of the single data collection directives on the attribute HRESULT. In my case everything was okay and the result codes are 0.
If you like to know how to simplify on-demand diagnostic log file gathering during day by day operations by using email notifications and automatic cleanup of the blob storage via a Logic App, then see my follow up post:
On-demand Windows Diagnostic Logs Email Notifications and Cleanup
Conclusion
I think this is very helpful and the way how modern management and troubleshooting must be done. Especially when we have to deal with devices around the globe, in home office situations, or just simply in different timezones. Remember this is available with Windows 10 Version 1903 or newer builds (Insider) and can be utilized with a MDM service like Intune.
As a quick reminder we have similar possibilities to collect Win32 App installation log files in case of an installation error when installing Win32 via Intune Management Extension.

See the official Microsoft documentation for this here:
Win32 app installation troubleshooting
https://docs.microsoft.com/en-us/intune/troubleshoot-app-install#win32-app-installation-troubleshooting
In my opinion both features are great new capabilities and addressing challenges in modern management when it comes to troubleshooting. The new DiagnosticLog CSP is a nice new Windows 10 MDM feature and Intune as a MDM service is used in this how-to to utilize the DiagnosticLog CSP. I hope the Intune UI will get this new functionality at some point in time also as it would simplify things a lot. But for now we have a way to utilize the DiagnosticLog CSP and everyone who is familiar with the more technical configurations in Azure and Intune can utilize it already for their 1903+ devices.
Great addition and the right move for modern troubleshooting!

Hello sir, making the assumption this works for Pro also?
Regards
Hey ho :-),
yes this works for the Windows 10 Pro edition also!
best,
Oliver
Good and useful article! This is surely needed, especially when you need to troubleshoot win32-app installs on devices that are internet only clients for example. 🙂
Hi Oliver,
another really nice article.
Do you know if you can call powershell from the command line ones?
i’m trying to get the list of members of local administrators but running the net localgroup is failing for some reason.
Thanks
Hi,
there are privacy guardrails in place for the DiagnosticLogs CSP. If the guardrails are violated the command might fail or not allowed to run. Guardrails define allowed paths, commands, extensions, etc. – C:\Users\… is not allowed for example. I’m don’t have exact information what is blocked or allowed. I tried the net localgroup as well in different ways but without success. It is a bit like try and error until we have more documentation for the CSP.
best,
Oliver
Cool thanks for letting me know. At least i’m not crazy 😀
lets wait on the full documentation then
This is extremely helpful when you are not able to touch the machines. I am trying to slightly modify the events portion of the collection. I cannot seem to get the syntax correct. In the application and Services log, I would like to pull these logs:
Applications and Services logs\Microsoft\Windows\Windows Defender\operational – I am not having any success. I have used:
Microsoft-Windows-Windows Defender/Operational
Windows Defender\Operational
Any many different variations thereof. I keep getting “conflict” as the deployment status. Im hoping you may have some additional insight as to have to call these events.
Let me clarify:
“Microsoft-Windows-Windows Defender/Operational”
“Windows Defender\Operational”
Hi Thomas,
I didn’t tried to collect a Services log until now, but actually from the documentation it tell us it should be “Microsoft-Windows-Windows Defender/Operational”. Maybe the space is a problem and it needs to be encapsulated in URL encode this would be the + or %20… so try it by replacing the space maybe….
Events
——–
Exports all events from the named Windows event log.
Expected input value: A named event log channel such as “Application” or “Microsoft-Windows-DeviceGuard/Operational”.
Output format: Creates a .evtx file.
https://docs.microsoft.com/en-us/windows/client-management/mdm/diagnosticlog-csp#diagnosticlog-csp-for-triggering-devices-to-upload-files-to-cloud
If this is not working as expected I would try to gather the evtx file itself via the path:
“C:\Windows\System32\winevt\Logs\Microsoft-Windows-Windows Defender%4Operational.evtx”
best,
Oliver
Is the date/time of a successful collection recorded anywhere? We are using this to regularly collect some log files that are generated, but hope to use the last successful collection as input to a cleanup script also.
Hi Ryan,
I’m currently not aware of any timestamp here. This doesn’t mean there is nothing logged, but in the normal registry key there is no timestamp and I don’t know where else they might have something. Currently I think they do not have one logged in the registry for this.
best,
Oliver
I have tried the %4 and a couple of other combinations. I will most likely open a support ticket and see if MS can provide the proper syntax. Ill update once I have it working. Thank you for the assistance!
Okay, thanks I’m curious about the outcome!
Hello Oliver, is this still the way to collect logs etc? I mean we have Endpoint Analytics etc
Hey Rkast,
For this topic you have a lot of options. You can still use the diagnostics CSP, in fact it will be integrated in the Intune UI (see features in development page https://docs.microsoft.com/en-us/mem/intune/fundamentals/in-development#collect-logs-remote-actions). Downside you will have to use the predefined set, but easy to use. You can use it like I described to add more individual stuff, or use endpoint analytics and push the files you need to a blob storage or SharePoint site or whatever you like.
Best,
Oliver